


Virtual Dashboard to Display Equipment Performance
Background
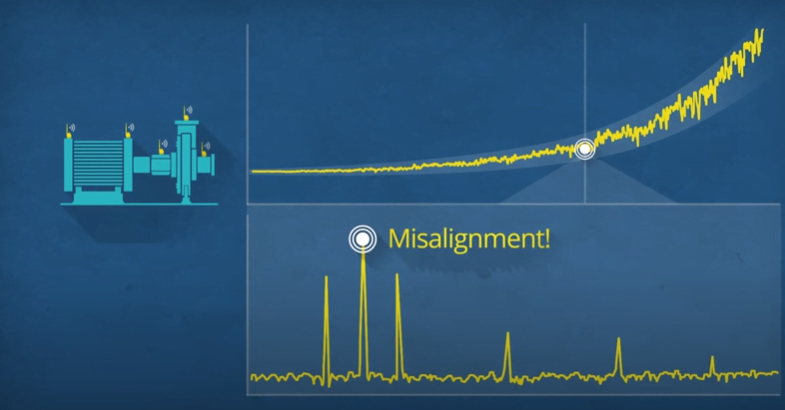
KCF Technologies develops wireless sensors and diagnostic software for real-time continuous monitoring of industrial equipment. The vibration sensors collect thousands of data points on machine health to alert employees to a problem in time to prevent a machine failure.
Background
KCF Technologies develops wireless sensors and diagnostic software for real-time continuous monitoring of industrial equipment. The vibration sensors collect thousands of data points on machine health to alert employees to a problem in time to prevent a machine failure.
Challenge
 The company wanted a visual dashboard to display the equipment’s performance on the factory floor. The display needed to alert workers when a piece of equipment changed from healthy to unhealthy. Site administrators also needed the ability to configure the display to select which sensor data to monitor on each machine.
Challenge
The company wanted a visual dashboard to display the equipment’s performance on the factory floor. The display needed to alert workers when a piece of equipment changed from healthy to unhealthy. Site administrators also needed the ability to configure the display to select which sensor data to monitor on each machine.
Solution
Skyward developed a web application to visually display the output of sensor data. Each piece of equipment had a single display depicting four gauges. The administrator would log in, select the plant location from a dropdown menu, and the indicators for each gauge, such as velocity, voltage or acceleration. Once each gauge was configured, the gauge would be labeled for easy tracking by machine operators. All data from the machines was pulled from web application interfaces to eliminate the need for direct interface with the equipment.